Cargologik Shipments Tracking
MY ROLE: Conceptualization, Design, Usability testing, Dev hand-off, Marketing assets
BACKGROUND
The logistics platform at Cargologik serves as the mission control for those who deal with logistics on a daily basis, namely Beneficial Cargo Owners (BCOs) and Logistics Service Providers (LSPs). The Shipments Tracking page is the most interacted with page of the application, providing a line-by-line view of the global cargo that our users need to keep a pulse on. Users rely on this view to monitor alerts, deep-dive into specific shipments, and generate high-level reports.
DISCOVERY
The original Shipments Tracking table suffered from three critical bottlenecks that hindered operational efficiency:
1. Extreme Visual Noise
2. Fragmented Filtering
3. Performance Lag
There was too much data visible at once along with a lack of precise filtering tools, making it difficult for users to find specific data or gain useful insights at a glance. This enormity of data visible all at once made the table slow to load, worsening the overall experience. Our users reported this to us and we knew we needed to address it to remain competitive.
To solve the "too much data all at once" problem, I facilitated a Data Hierarchy Workshop with Product and Engineering teams. We categorized every shipment attribute into three buckets:
Primary (Always Visible): Unique Identifiers (Ref/Container #), ETA/ATA, ETD/ATD, Origin/Destination, and Status.
Secondary (Contextual): Carrier, Holds/Fees, and Demurrage.
Tertiary (Drill-down): Nuanced shipment history and documentation.
To support our hierarchy exercise, we also conducted user interviews to help us validate which attributes were most important to our users and to better understand their workflows.
Our findings allowed us to align on a consolidated set of default columns, new top-level filters on the top of the table, and additional more granular filters to include in a new side panel.
ITERATIONS
Consolidation of data with contextual columns and tooltips
Part of the table consolidation work required me to find ways to minimize redundancy and show relevant data in intuitive ways to minimize the fatigue the old table brought with it.
Date columns were a good place to start. Planned, Estimated, and Actual date columns were timestamps marking the departure or arrival times of a shipment as its status progressed.
There are implied use cases depending on which of these fields a user is looking for:
Planned: The user is filtering for shipments that have not yet shipped.
Estimated: The user is filtering for live shipments currently or about to be in transit.
Actual: The user is filtering for shipments that have completed one leg of transit; either departed or arrived at their destination.
Understanding our users’ need for precise data, the granularity of the time data was not abandoned and was captured in the tooltips for each cell, allowing a reduction in the table’s horizontal footprint by 33% while not compromising on the full data.
Previously
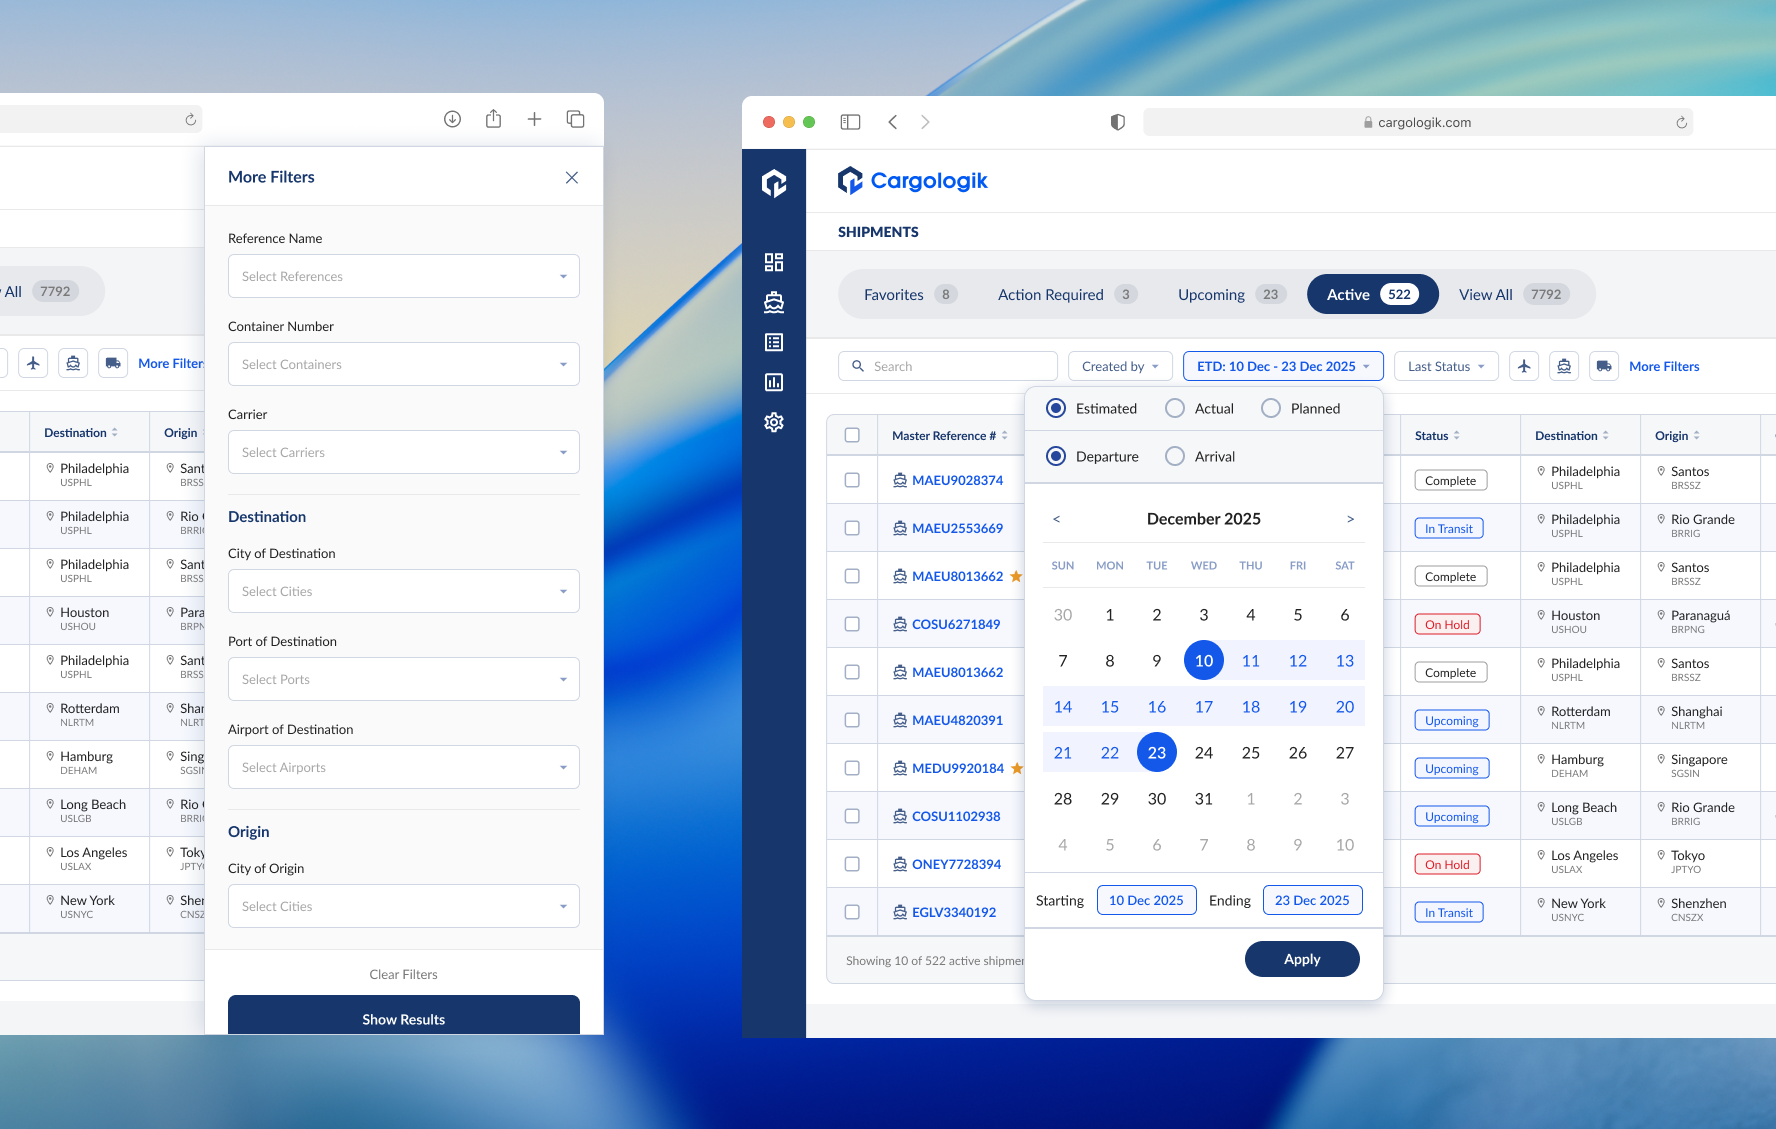
Integrated date picker
To complement the consolidation of dates by context as described above, I created a more intuitive date filter. The new date picker was visual with integrated radio buttons for selecting between Planned, Estimated, and Actual milestones for either Departure or Arrival dates.
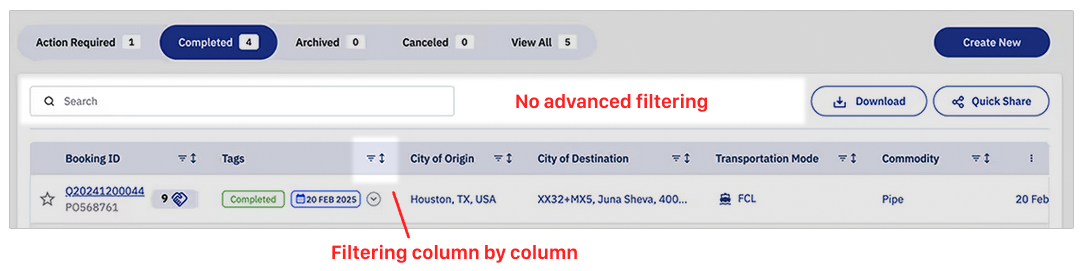
Previously, filters were only applied on a column by column basis, meaning since we had different columns for PTD, ETD, ATD, PTA, ETA, ATA, we had 6 different dates to filter on.
The new date picker accommodated the nuances of contextual dates as well. For example a user might want to see all shipments that were planned to depart on a certain date, even if the final reported data on those shipments logged an actual departed date that was different.
The new date picker, along with the other newly implemented filters, brought new levels of control for our users over their shipping data.
More precise filters
Expanding on the need for granularity and precision, a need we could not compromise on while I sought to consolidate and focus the Shipment Tracking table, a side panel of additional filters was the obvious solution. Hiding these more advanced filters from immediate view meant less noise on the main table, while simultaneously serving as a significant improvement to the filtering experience in comparison to the outdated column-embedded filters in the previous version of the table.
Working closely with the engineering team, I mapped all existing column filters to their new home in the side panel. This required another exercise in hierarchy to decide the order of the filters.
The side panel of filters was the final component that we built, so before we shipped it we tested our decisions with our users directly in another round of feedback which would ultimately validate the user behaviour that informed my design decisions.
FINAL RESULT
Through an iterative process, beginning with a refresh of the table, then to implementing the top-level filters, then finally the additional filters, I drove the Shipments Tracker refresh to completion. We found that even given the fact that our users in this industry are driven by precise data, we didn’t always necessarily need to show more data, we just needed to communicate the right information that helped them do their work more efficiently.
We cut load times by over 50% and the project required us to clean and categorize our data to allow for filters, now and in the future, to function without issue.
We shipped this refresh to a dozen of our users, testing out the new user experience of interacting with the table and filters, and making sure the data maintained its integrity. The cumbersome table was now more streamlined and our users can view alerts and status updates on their shipments more easily and can action on them within seconds.